Welcome
Welcome to the Reproducible Data Science unit BIOL33031. All the videos in these workshops are best viewed in fullscreen mode at 1080 resolution. I have recorded the audio with a podcasting microphone, so the recordings are best listened to with headphones. YouTube generates subtitles automatically, so please turn those on if you’d find them useful.
This unit will be run via a flipped classroom model. This means you need to go through each of the workshops before the associated Zoom session. So make sure you’ve gone through all of the Workshop 1 content before our first scheduled Zoom session. Each of the workshops should take you about 4 hours to complete - so give yourselves plenty of time to go through all of the content before each Friday Zoom session.
There is one assignment associated with this unit. The full details of this (plus hand in date) can be found on Blackboard.
Week 1
There are two parts to this week’s workshop. The first is on Open Research and Reproducibility, the second on Starting with R and RStudio Desktop. Make sure you complete both parts before the first timetabled session.
Open Research and Reproducibility
In this first part, I will introduce you to the key concepts in open research, and talk about the so-called “replication crisis” in the Psychological, Biomedical, and Life Sciences that has resulted in the Open Research movement I will also discuss the importance of adopting reproducible research practices in your own research, and provide an introduction to various tools and processes you can incorporate into your own research workflows that will allow you to conduct reproducible research. To go to the first part, just click on the image below.
Starting with R and RStudio Desktop
In the second part, I will introduce you to R (the language) and RStudio Desktop (the environment we use to interact with the language). I’ve also added a link to a great talk by the founder of RStudio, J.J. Alaire. At the end I have put together a video which will show you how to run your first R script.
Week 2
There are three parts to this week’s workshop The first part is on Data Wrangling, the second on Summarising Your Data, and the third on Data Visualisation.
Data Wrangling
In the first part I will introduce you to a number of key packages
known as the Tidyverse These packages contain a large
number of functions for working with data in tidy format. By making our
data wrangling reproducible (i.e., by coding it in R), we can easily
re-run this stage of our analysis pipeline as new data gets added.
Reproducibility of the data wrangling stage is a key part of the
analysis process and often gets overlooked in terms of needing to ensure
it is reproducible. To go to this first part, just click on the image
below.
Summarising Your Data
Once you have completed this first part and have your R script up and running, click on the image below for the second part where you’ll learn how to aggregate and summarise your data.
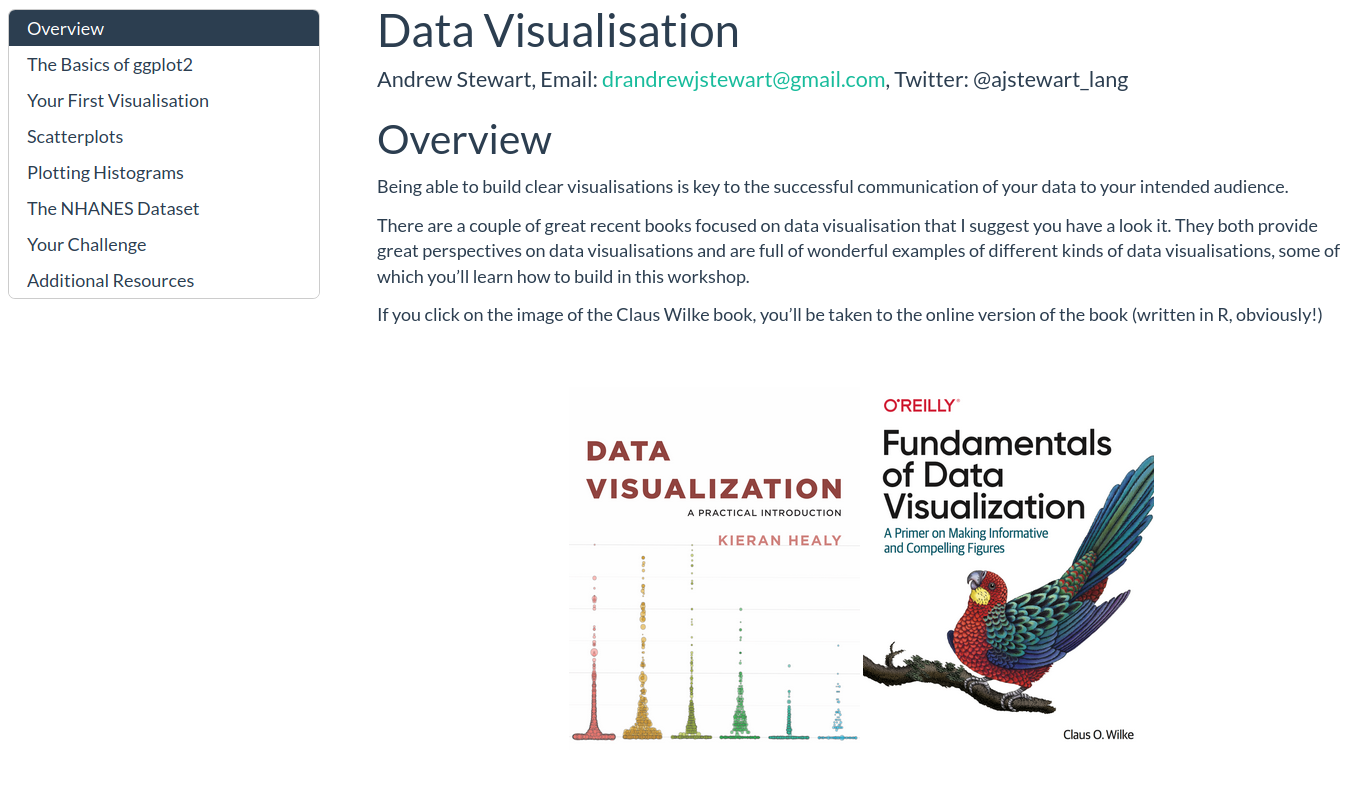
Data Visualisation
In part three, we will explore the basics of Data Visualization using R. You’ll have the opportunity to write an R script on your own computer that will generate some nice data visualisations. Just click on the image below to start.
Week 3
There are two parts to this week’s workshop. In the first part we will examine Simple Linear Regression (where you build a linear model to predict an outcome variable on the basis of a predictor variable). In the second part we will move onto Multiple Linear Regression ((where you build a linear model to predict an outcome variable on the basis of a number of predictor variables).
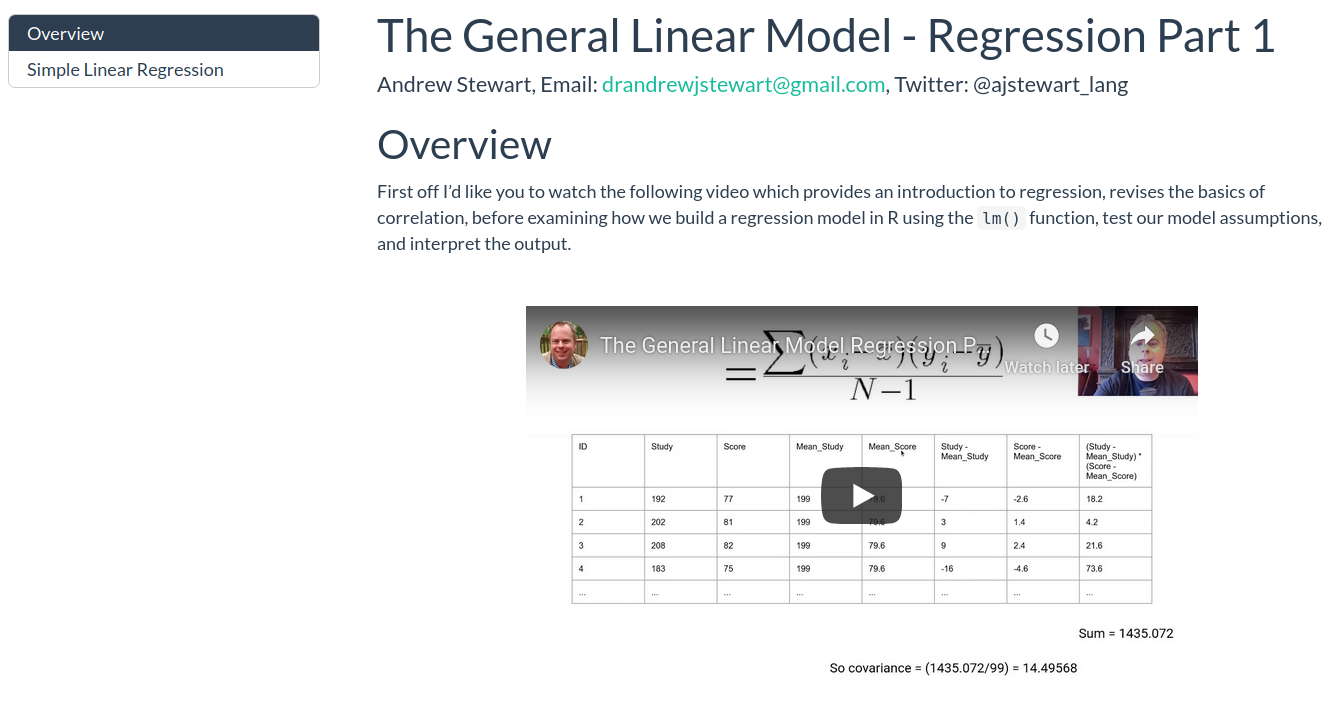
Regression Part 1
In part one we will explore Simple Regression in the context of the General Linear Model (GLM). You will also have the opportunity to build some regression models where you predict an outcome variable on the basis of one predictor. You will also learn how to run model diagnostics to ensure you are not violating any key assumptions of regression.
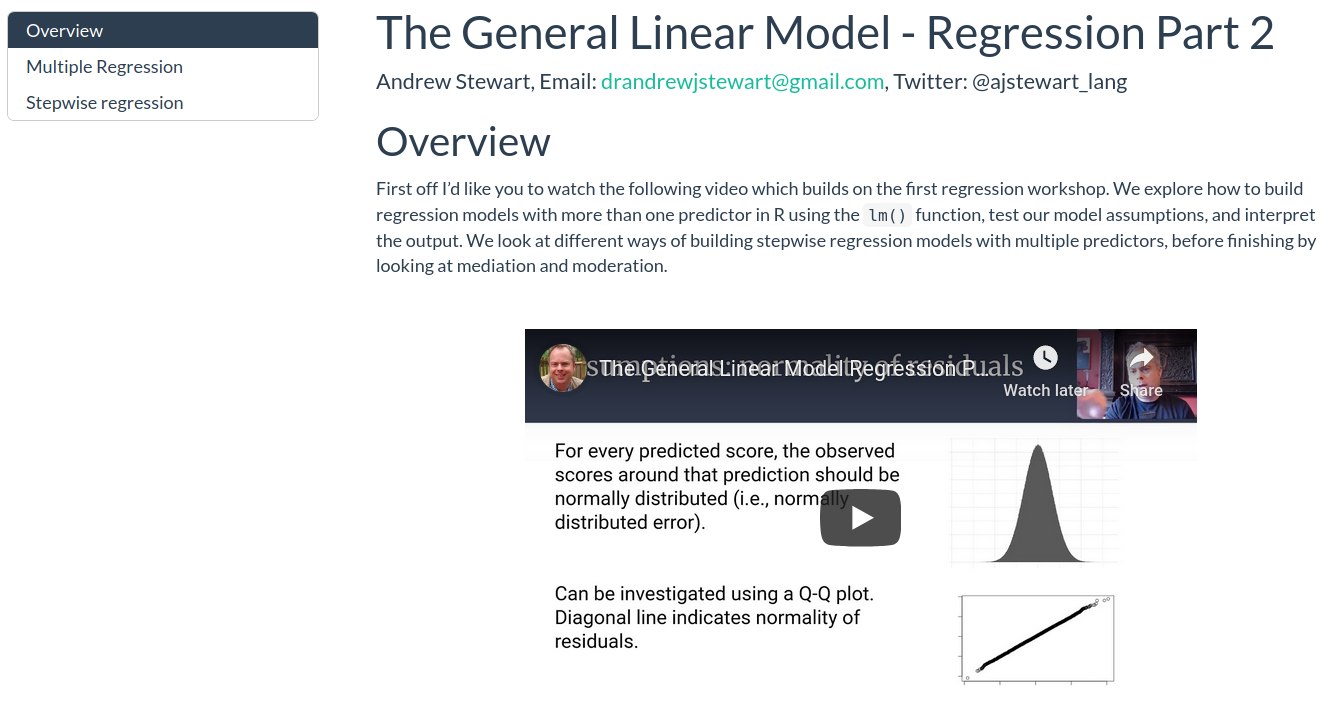
Regression Part 2
In part two we will explore Multiple Regression in the context of the General Linear Model (GLM). Multiple Regressions builds on Simple Regression, except that having one predictor (as is the case with Simple Regression) we will be dealing with multiple predictors. Again, you will have the opporunity to build some regression models and use various methods to decide which one is ‘best’. You will also learn how to run model disagnostics for these models as you did in the case of Simple Regression.
Week 4
This week we will cover Analysis of Variance (ANOVA), Analysis of Covariance (ANCOVA), and show how they are both special cases of the General Linear Model.
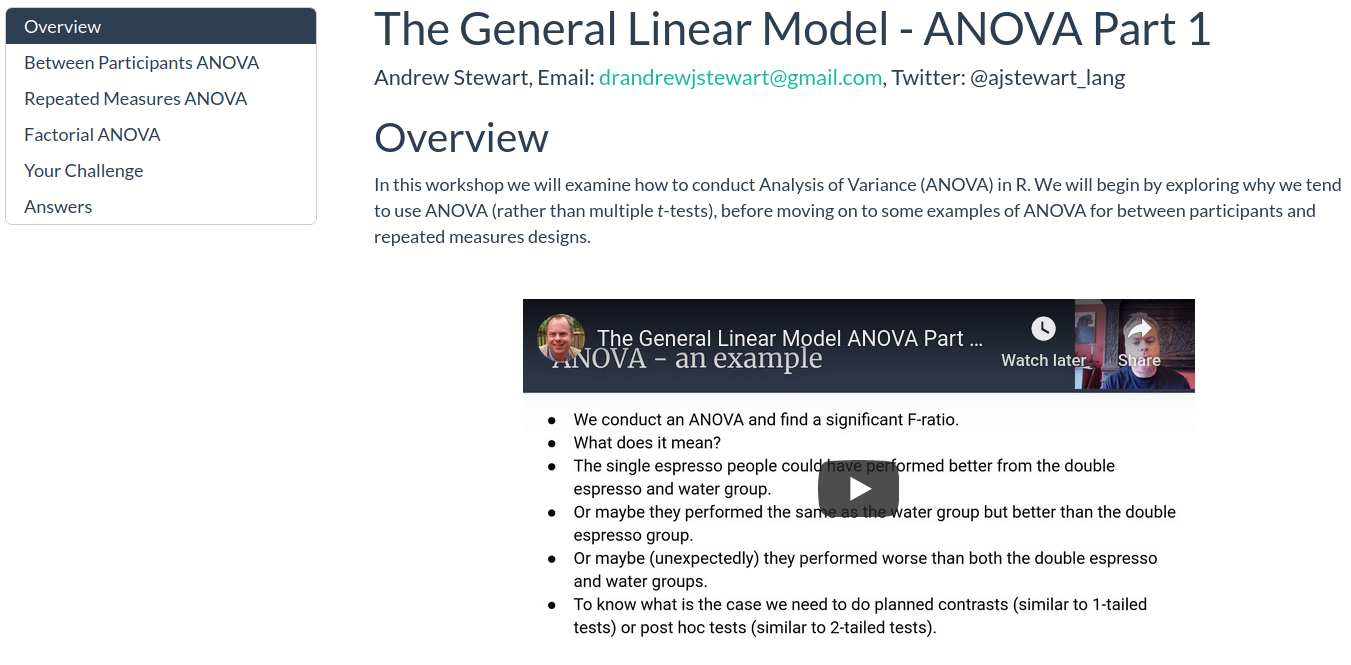
ANOVA Part 1
In part one we will explore Analysis of Variance (ANOVA) in the
context of model building in R for between participants designs,
repeated measures designs, and factorial designs. You will learn how to
use the {afex} package for building models with Type III
Sums of Squares, and the {emmeans} package to conduct
follow up tests to explore main effects and interactions.
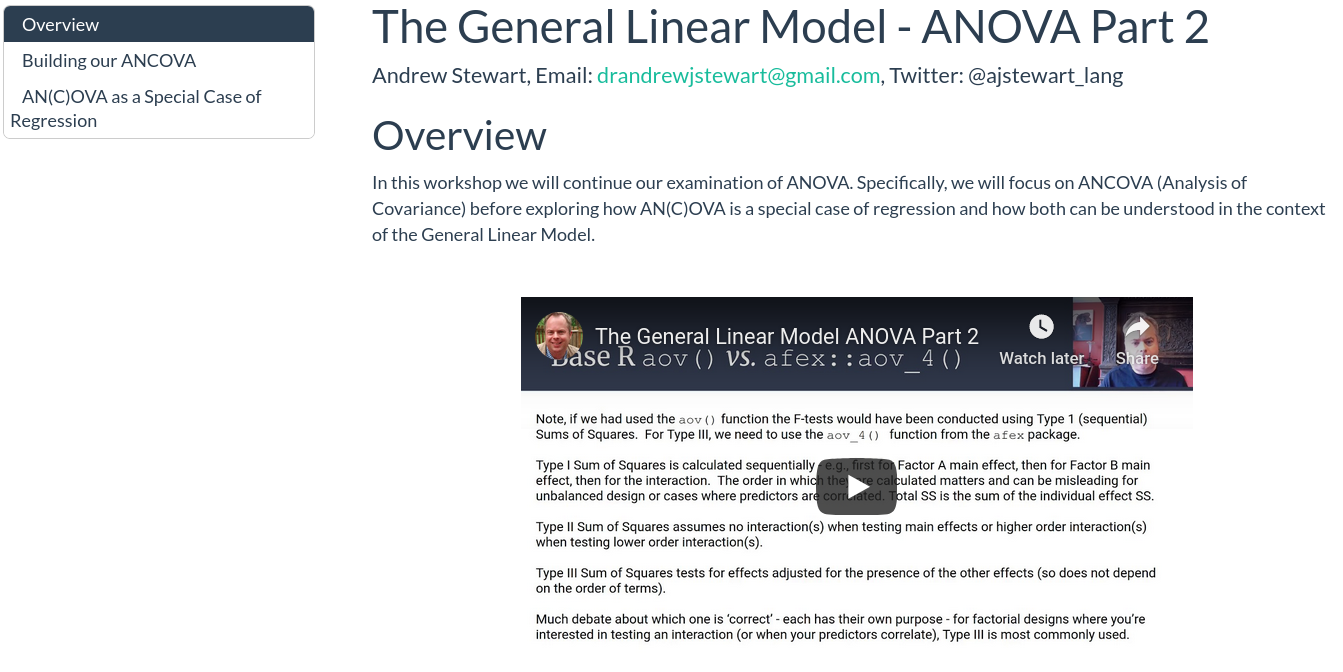
ANOVA Part 2
In part two we will explore Analysis of Covariance (ANCOVA). We will also examine ANOVA and ANCOVA as special cases of regression and see how we can build both via a linear model. By then doing this yourselves, you wil hopefully be convinced that ANOVA and regression are really the same thing.
Week 5
There are three parts to this week’s content. The first two part
focus on Mixed Models, while the third focuses on using R Markdown. Your
assignment for this unit needs to be created using R Markdown. You will
then knit your R Markdown file to generate a
.html file. It is this .html file that you
need to submit as your assignment.
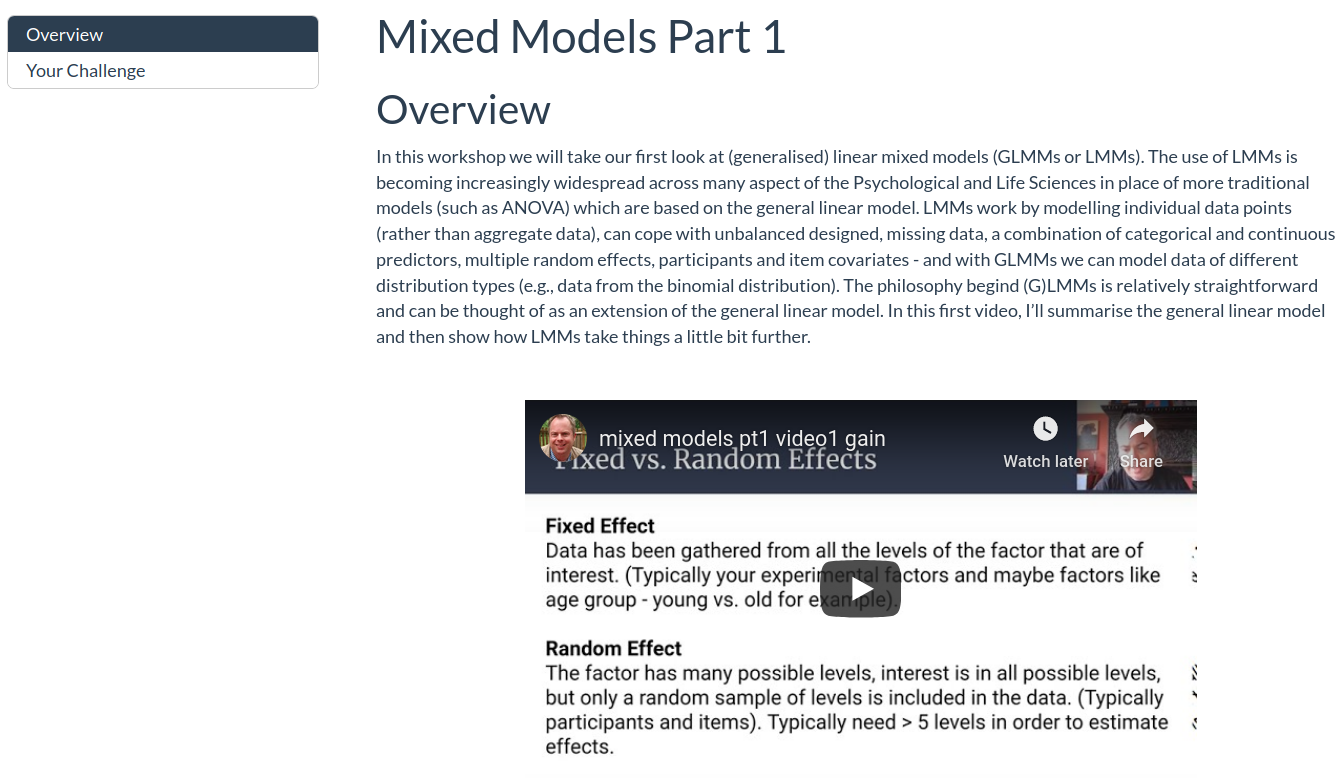
Mixed Models Part 1
In this first part we will see how mixed models combine aspects of linear regression (for model fitting) while circumventing the need for observations to be independent of each other. We will also examine how we model the influence of random effects in our mixed models, and see how mixed models can cope with unbalanced designs and missing data.
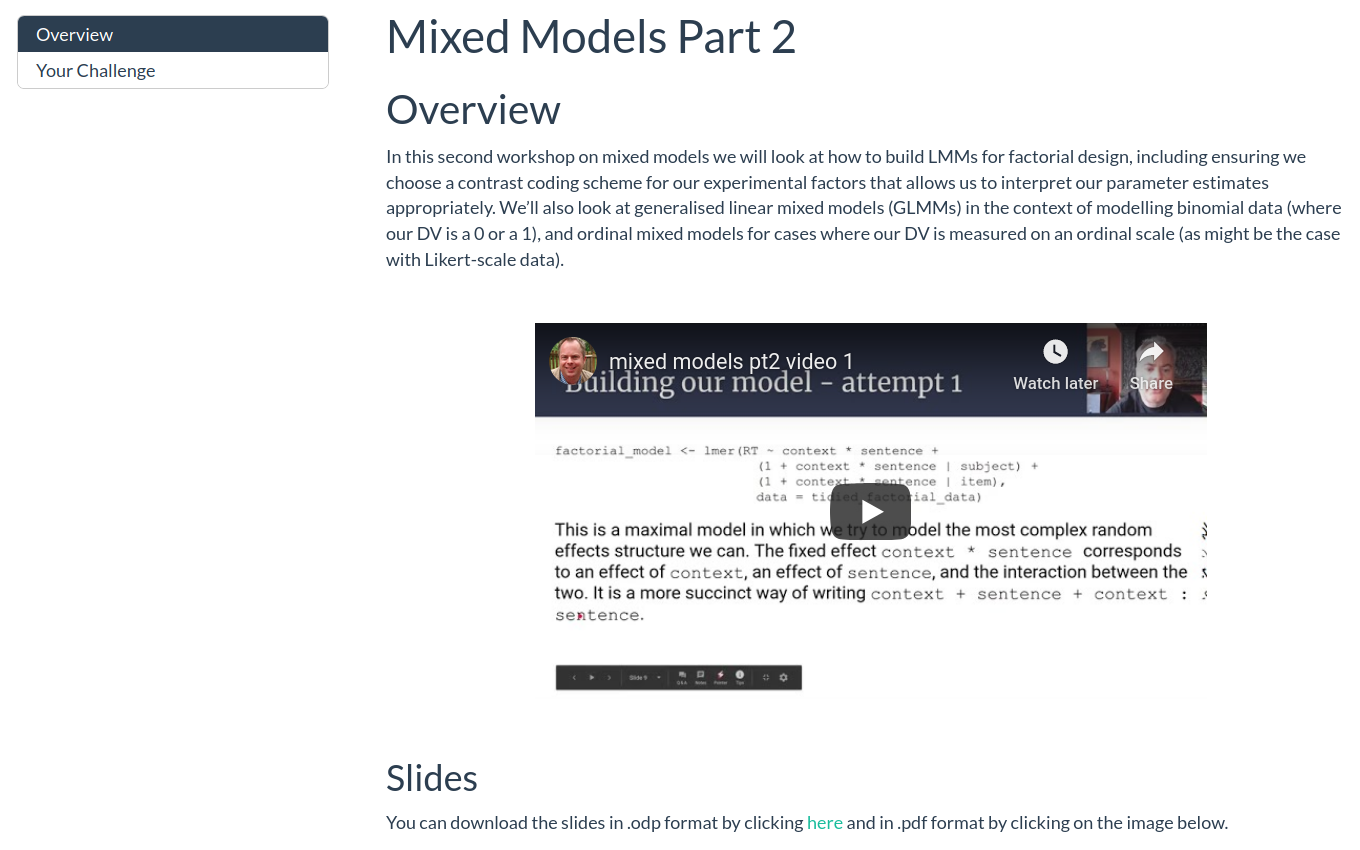
Mixed Models Part 2
In the second part we will examine mixed models for factorial
designs, and explore how to model non-continuous dependent variables
(e.g., binary and ordinal outcome variables) using the
glmer() family of mixed models.
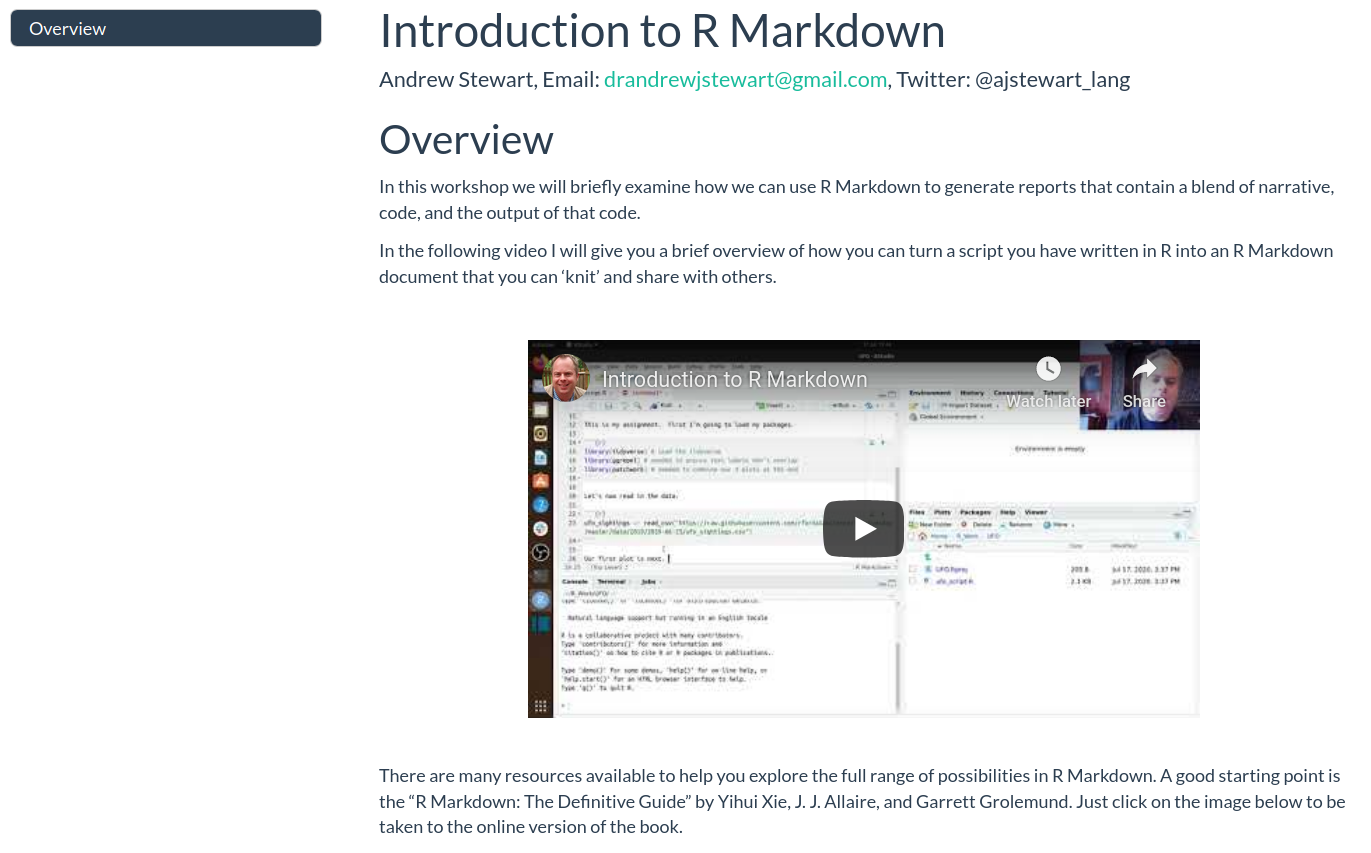
R Markdown
In the final part I will show you how to generate a report in
.html format using R Markdown. Reports written using R
Markdown allow you to combine narrative that you’ve written alongside R
code chunks, and the output associated with those code chunks all in one
knitted document. The assignment for this unit needs to be
produced using R Markdown and you need to submit the .html
file you generate using R Markdown via Blackboard.
Week 6
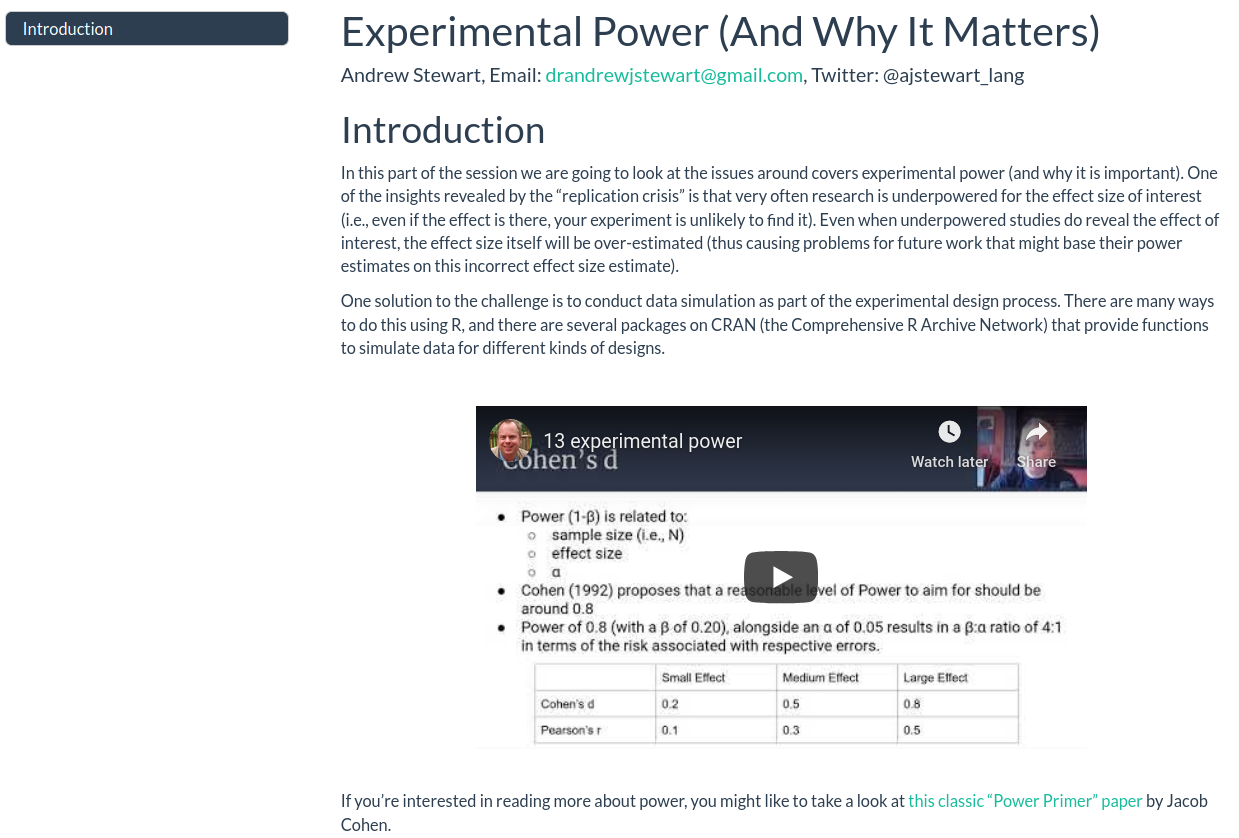
Experimental Power
This workshop covers experimental power (and why it is important). One of the insights revealed by the “replication crisis” is that very often research is underpowered for the effect size of interest (i.e., even if the effect is there, your experiment is unlikely to find it). Many of the issues stem from researchers not spending sufficient time considering the power aspects of their research design. In this workshop, I’ll provide you with an overview of some of the issues - just click on the image below to view this:
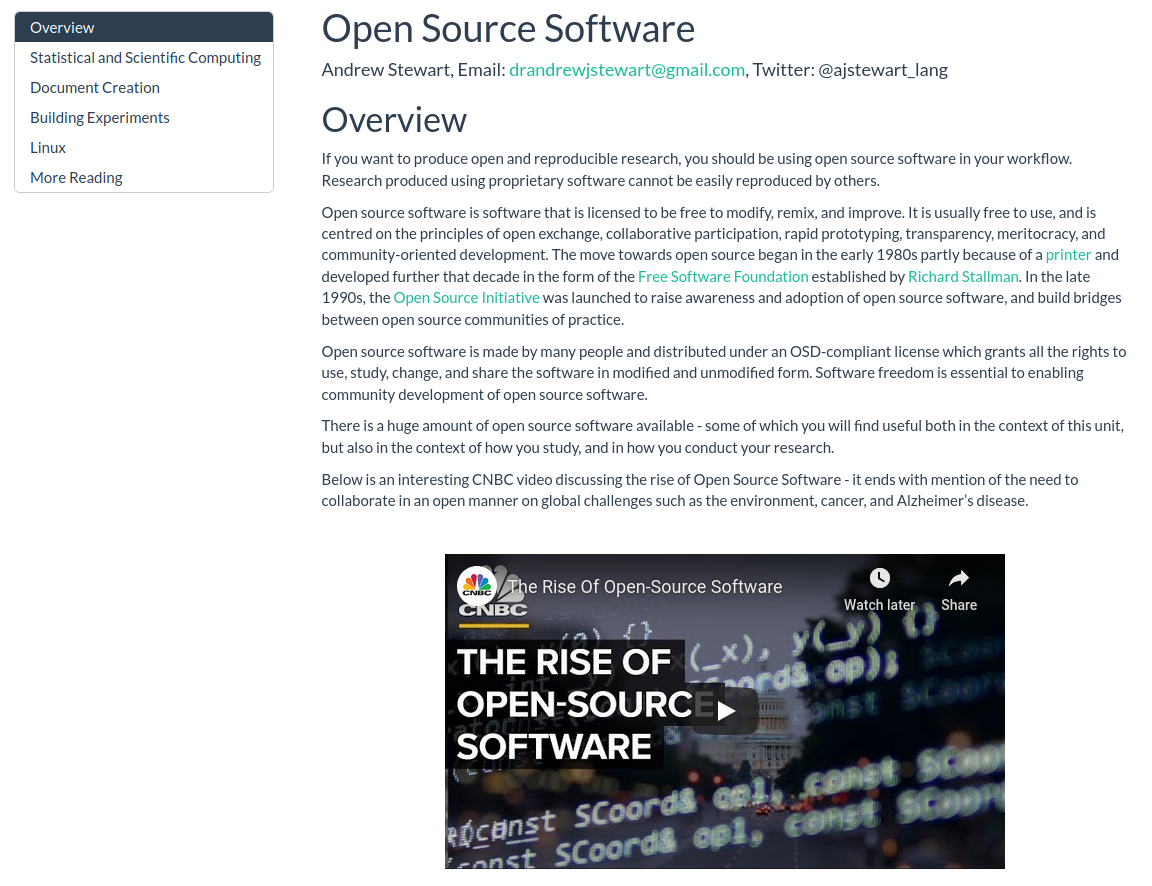
Open Source Software
This workshop provides a very brief overview of open source software, the use of which is arguably key for researchers to be able to adopt open and reproducible research workflows. To view this part, just click on the image below.
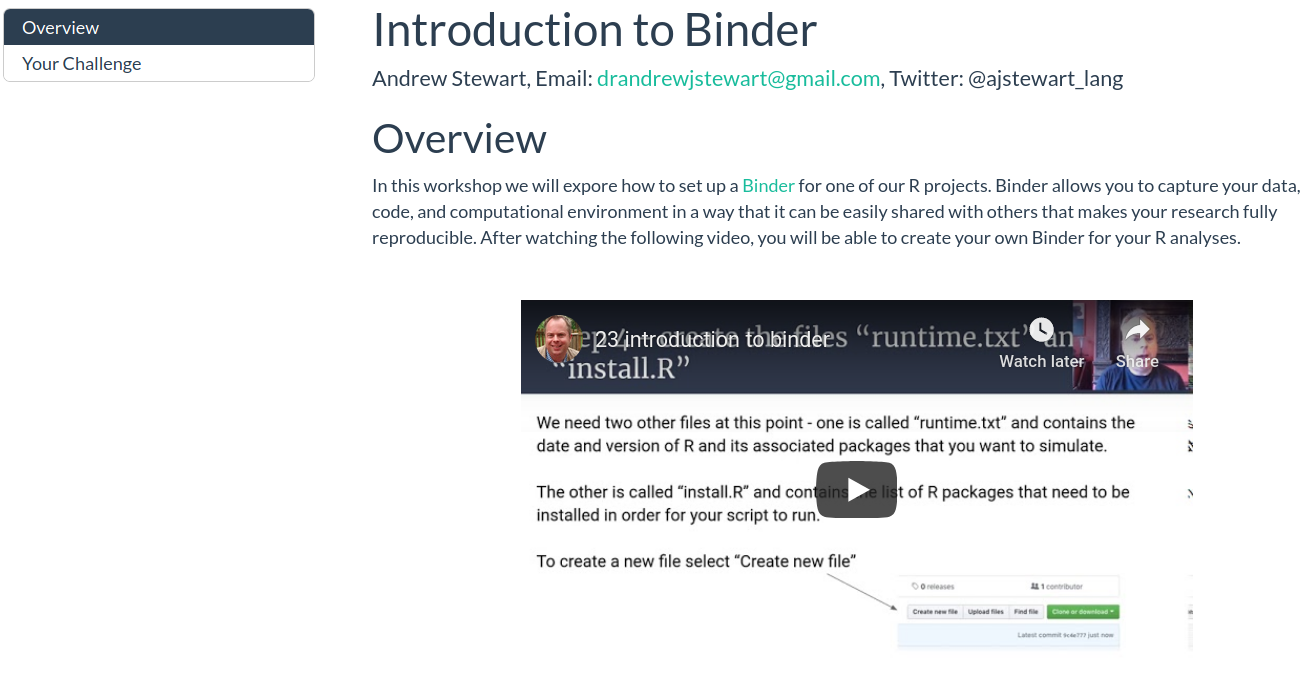
Binder
This workshop will introduce you to Binder, a tool for allowing you to reproduce your computational environment, as well as your code and data, and share all of these with a collaborator via a simple web link.
Technical Details
All of the material in this workshop was created using open source where possible using an Entroware Apollo laptop running GNU/Linux distro Ubuntu 20.04 LTS (Focal Fossa). The audio was captured with a Fifine USB Podcasting microphone and the video with a Razer Kiyo webcam. The audio and video were recorded using Open Broadcast Software and edited using Shotcut. The R code was written using R 3.6.3, and run in the RStudio Desktop IDE version 1.3.959. Ubuntu 20.04 LTS (Focal Fossa), OBS, Shotcut, R, and RStudio Desktop are all open source.
The structure for this unit was very much inspired by the Sharing At Short Notice webinar by Alison Hill and Desirée De Leon.
The repo for each workshop can be accessed via the ‘Improve this Workshop’ link at the bottom of each workshop page. The workshops and this website were all written using R Markdown and the website is hosted on Netlify via continunous deployment from this GitHub repository.
The source code for each of the Workshops above is licensed under the MIT license, and the lecture content under CC-BY.